Python Tutorial for Data Science Beginners
If you’re just starting and want to dive into the world of data, this Python tutorial for data science beginners is here to guide you. Data science is all about using data to find patterns, make decisions, and solve problems. Python makes it easy because it’s simple to read and has powerful tools. Many people choose Python for data work because it’s free, works on most computers, and has a big community to help you. In this guide, we’ll cover everything from the start, so even if you’ve never coded before, you can follow along.
Think of data science as exploring a treasure map. The data is the map, and Python helps you find the treasure. We’ll start with the basics and build up to real tasks. By the end, you’ll feel confident handling data like a pro. Let’s get going!
Why Choose Python for Data Science?
Python stands out in data science for good reasons. It’s easy to learn, which is perfect for beginners in Python who are new to data science. Unlike some languages that feel complicated, Python reads like English. This helps non-programmers jump in fast.
Experts say over 80% of data scientists use Python daily. Sites like Stack Overflow show millions of questions about Python for data science beginners, proving its popularity. It handles big data sets without trouble and connects well with other tools.
Python also shines in automation. You can write code once and run it many times, saving hours. For career changers aiming to build practical Python skills for data analysis, this means quick wins. Plus, jobs in data science pay well – average salaries top $100,000 in many places.
To see why it ranks high, look at trusted sources. They focus on clear steps and real examples, which we’ll do here too. If you’re a student moving from basic coding, Python bridges the gap smoothly.
Setting Up Your Python Environment
Before we code, set up your tools. This is key for any Python data science tutorial.
First, download Python from the official site. Go to python.org and pick the latest version, like 3.12. It’s free and installs in minutes.
Next, install an editor. We recommend Jupyter Notebook for data work. It lets you run code in small parts and see results right away. To get it, open your command line and type:
pip install notebook
Run it with:
jupyter notebook
This opens a web page where you create notebooks. They’re great for mixing code, text, and pictures.
For libraries, use pip. It’s Python’s package manager. We’ll install main ones later, but start with:
pip install numpy pandas matplotlib
If you hit errors, check your Python path. Common fixes include restarting your computer or updating pip with:
pip install –upgrade pip
For more on fixing code issues, see this guide on debugging techniques.
This setup takes under 30 minutes. Once done, you’re ready to explore data science using Python.
Python tutorial for data science beginners
Let’s cover core Python skills. This is for those with little or no prior experience in programming.
Start with variables. They’re like boxes holding data. For example:
age = 25
name = “Alex”
Print them with:
print(age)
print(name)
Numbers and text are basic types. Lists hold many items:
fruits = [“apple”, “banana”, “cherry”]
Access the first with fruits[0].
Loops repeat tasks. A for loop goes through a list:
for fruit in fruits:
print(fruit)
Functions group code. Define one:
def greet(name):
print(“Hello, ” + name)
Call it: greet(“Alex”)
Conditionals make choices:
if age > 18:
print(“Adult”)
else:
print(“Minor”)
These are building blocks for data analysis with Python. Practice in your notebook. If you’re a self-learner, try changing the code to see what happens.
For errors like recursion limits, check this fix guide.
Introducing Key Python Data Science Libraries
Libraries are pre-made tools. They’re why Python excels in data.
First, NumPy for data science. It handles numbers fast. Install with pip install numpy.
Import it:
import numpy as np
Make an array:
arr = np.array([1, 2, 3, 4])
Do math:
mean = np.mean(arr)
print(mean) # Outputs 2.5
Next, Pandas library tutorial. Pandas deals with tables. Install: pip install pandas.
Import:
import pandas as pd
Create a DataFrame:
data = {‘Name’: [‘Anna’, ‘Bob’], ‘Age’: [28, 34]}
df = pd.DataFrame(data)
View it: print(df)
Pandas reads files like CSV:
df = pd.read_csv(‘file.csv’)
For pictures, Matplotlib data visualization. Install: pip install matplotlib.
Import:
import matplotlib.pyplot as plt
Plot:
plt.plot([1, 2, 3], [4, 5, 6])
plt.show()
These are python data science libraries basics. We’ll use them more soon.
If you need help with imports, see this TensorFlow fix.
Data Loading and Manipulation
Now, get data into Python. This is core to Python data manipulation.
Start with CSV files. They’re common for data.
df = pd.read_csv(‘data.csv’)
Check the top rows: df.head()
For Excel: df = pd.read_excel(‘file.xlsx’)
JSON: df = pd.read_json(‘file.json’)
From web: Use requests library, but for basics, stick to files.
Once loaded, manipulate. Select columns:
ages = df[‘Age’]
Filter rows:
adults = df[df[‘Age’] > 18]
Group data:
grouped = df.groupby(‘City’)[‘Salary’].mean()
This gives the average salary per city.
Join tables:
merged = pd.merge(df1, df2, on=’ID’)
Handle big data carefully to avoid crashes.
For more on data handling, link to clean code principles.
These steps make data preprocessing in python straightforward.
Handling Missing Data and Cleaning
Data often has gaps. Clean it to avoid bad results.
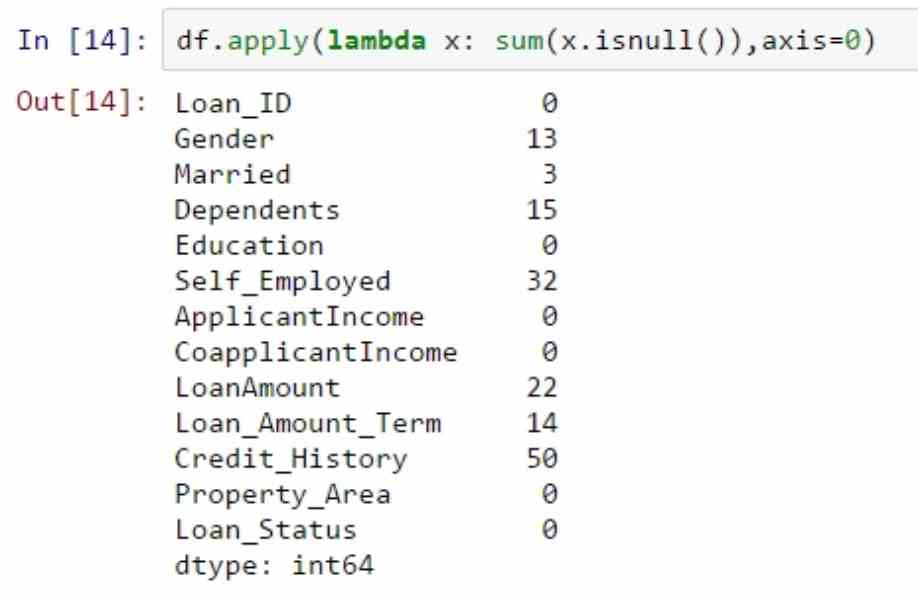
Check missing:
print(df.isnull().sum())
Fill with average:
df[‘Age’].fillna(df[‘Age’].mean(), inplace=True)
Drop rows:
df.dropna(inplace=True)
Remove duplicates:
df.drop_duplicates(inplace=True)
Scale numbers for fairness:
from sklearn.preprocessing import MinMaxScaler
scaler = MinMaxScaler()
df[‘Scaled’] = scaler.fit_transform(df[[‘Value’]])
Detect outliers with Z-score:
from scipy import stats
z = np.abs(stats.zscore(df[‘Value’]))
df = df[z < 3]
This keeps data clean. It’s vital for exploratory data analysis python.
If you face module errors, try this array fix.
Exploratory Data Analysis (EDA)
EDA finds stories in data. It’s like detective work.
Describe data:
print(df.describe())
This shows min, max, average.
Correlation:
corr = df.corr()
print(corr)
High numbers mean linked variables.
Univariate: Look at one variable.
df[‘Age’].hist()
Bivariate: Two variables.
plt.scatter(df[‘Age’], df[‘Salary’])
Multivariate: Use pairplot from Seaborn.
Install seaborn: pip install seaborn
import seaborn as sns
sns.pairplot(df)
This reveals patterns. For beginner data science concepts, start here.
Practice on free datasets from Kaggle.
Data Visualization Techniques
Visuals make data pop. Use matplotlib data visualization and more.
Bar chart:
plt.bar(df[‘City’], df[‘Count’])
plt.show()
Line plot for trends:
plt.plot(df[‘Date’], df[‘Value’])
Scatter for relations:
plt.scatter(df[‘X’], df[‘Y’])
Add labels:
plt.xlabel(‘X Axis’)
plt.ylabel(‘Y Axis’)
plt.title(‘My Plot’)
For interactive, try Plotly: pip install plotly
import plotly.express as px
fig = px.scatter(df, x=’X’, y=’Y’)
fig.show()
Maps with Folium for locations.
This helps in data analysis with python.
For speed tips, see PageSpeed guide.
Basic Statistics in Python
Stats back up findings. Use python statistics tutorial.
Mean, median, mode:
from statistics import mean, median, mode
print(mean(data))
Standard deviation:
import numpy as np
print(np.std(data))
Variance: np.var(data)
Percentiles: np.percentile(data, 50)
Correlation: np.corrcoef(x, y)
Tests like t-test:
from scipy.stats import ttest_ind
stat, p = ttest_ind(group1, group2)
If p < 0.05, difference matters.
This is python for machine learning basics foundation.
For code updates, check Python update guide.
Introduction to Machine Learning with Python
ML lets computers learn from data.
Start with Scikit-learn: pip install scikit-learn
from sklearn.model_selection import train_test_split
X_train, X_test, y_train, y_test = train_test_split(X, y, test_size=0.2)
Linear regression:
from sklearn.linear_model import LinearRegression
model = LinearRegression()
model.fit(X_train, y_train)
Predict: model.predict(X_test)
Score: model.score(X_test, y_test)
Classification with logistic:
from sklearn.linear_model import LogisticRegression
Similar steps.
Tune with GridSearchCV.
This is introduction to data science with python.
For API security in ML, see API guide.
Python Data Science Projects for Beginners
Projects build skills. Try these python data science projects for beginners.
- Analyze sales data: Load CSV, find top products.
Code:
df = pd.read_csv(‘sales.csv’)
top = df.groupby(‘Product’)[‘Sales’].sum().sort_values(ascending=False)
print(top)
- Predict house prices: Use regression on dataset.
- Sentiment analysis: Use textblob on reviews.
pip install textblob
from textblob import TextBlob
sentiment = TextBlob(text).sentiment
- Visualize weather: Plot temperatures over time.
Get data from free APIs, but use files for start.
These follow a beginner friendly python data science roadmap.
For project bugs, fix LSTM import.
Advanced Topics in Python for Data Science
Once basics click, go deeper.
Big data with Dask: Handles larger-than-memory data.
pip install dask
import dask.dataframe as dd
df = dd.read_csv(‘big.csv’)
Time series with Pandas: df[‘Date’] = pd.to_datetime(df[‘Date’])
Resample: df.resample(‘M’).mean()
Web scraping with BeautifulSoup: pip install beautifulsoup4
from bs4 import BeautifulSoup
Parse HTML for data.
Databases: Use SQLAlchemy for SQL.
These expand your python data science training.
For system design, interview guide.
Common Challenges and Tips
Newbies face hurdles. Here’s help.
Error: Module not found. Fix: pip install missing.
Slow code: Use vectorized operations in NumPy.
Big files: Read in chunks with pd.read_csv(chunksize=1000)
Tip: Comment code well.
for average
mean = np.mean(arr)
Join communities like Reddit’s r/learnpython.
For burnout, read preventing developer burnout.
Stay updated with Python versions.
FAQs
What is the best way to start a Python tutorial for data science beginners?
The best way is to first install Python and Jupyter Notebook on your computer. Then begin with simple basics like variables, data types, lists, loops, and functions. After that, move straight into data science tools so you can see real results fast.
Is Python for data science beginners hard?
No, Python is one of the easiest languages for beginners in data science. With clear, step-by-step guides and practice, even people with zero coding experience do well. Most beginners feel comfortable after just a few days of regular learning.
What libraries are in a beginner Python data science course?
The most important starter libraries are NumPy, Pandas, and Matplotlib. NumPy helps with numbers and math, Pandas is great for working with tables of data, and Matplotlib lets you make simple charts and graphs. These three cover almost everything a beginner needs at first.
How long to learn Python for data science?
You can learn the basic Python skills in just a few weeks if you practice every day. To feel good with data science tools and simple projects, it usually takes 2 to 4 months. Going deeper with advanced topics can take many more months or even years.
Can I learn data science with Python online for free?
Yes, there are tons of excellent free resources available online right now. Popular ones include free courses on Coursera, YouTube channels, Kaggle tutorials, and websites like freeCodeCamp.
Conclusion
This python tutorial for data science beginners covered setup, basics, libraries, analysis, visualization, stats, ML, and projects. You’ve got tools to start exploring data confidently. Remember, practice is key – try code daily.
What data project will you tackle first? Share in comments!
References
For more, check these trusted sources:
- W3Schools Data Science Tutorial – Great for interactive examples and stats basics, ideal for beginners building foundational knowledge.
- Codecademy Learn Python for Data Science – Hands-on path with projects, perfect for self-learners transitioning to data workflows.
- GeeksforGeeks Data Science with Python – Detailed on libraries and preprocessing, suited for tech pros needing context.