App Retention Rate Benchmarks: Key Insights and Strategies
App retention rate benchmarks help you see how well your mobile app keeps users coming back. In 2025, most apps lose many users quickly. On average, only about 25% of users return the next day after installing an app. By day 7, that drops to around 10-13%, and by day 30, it’s often just 4-7%. These numbers come from reports by companies like AppsFlyer, Adjust, and others. Knowing these app retention rate benchmarks lets product managers, marketers, and developers compare their app’s performance. It shows if your app is doing better or worse than others in the same category.
Retention matters because getting new users costs a lot. Keeping the ones you have is cheaper and builds long-term success. High retention means users find real value in your app. Low retention signals problems like bad onboarding or missing features. This guide breaks down the latest benchmarks. You’ll learn averages across platforms, industries, and more. We also share tips to improve your numbers.
What Is App Retention Rate?
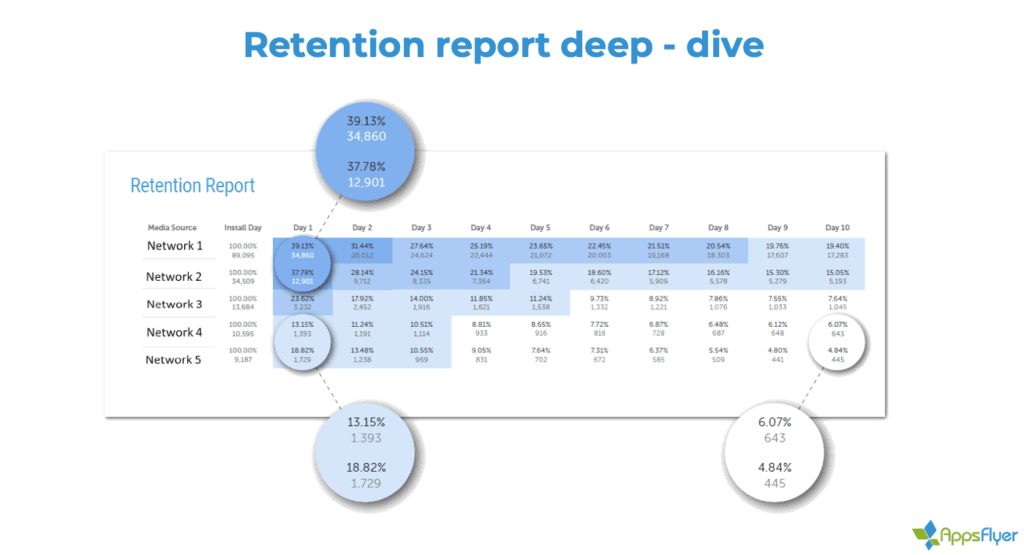
App retention rate measures the percentage of users who keep using your app over time. Teams often track it at key points: Day 1 (next day after install), Day 7 (one week), and Day 30 (one month).
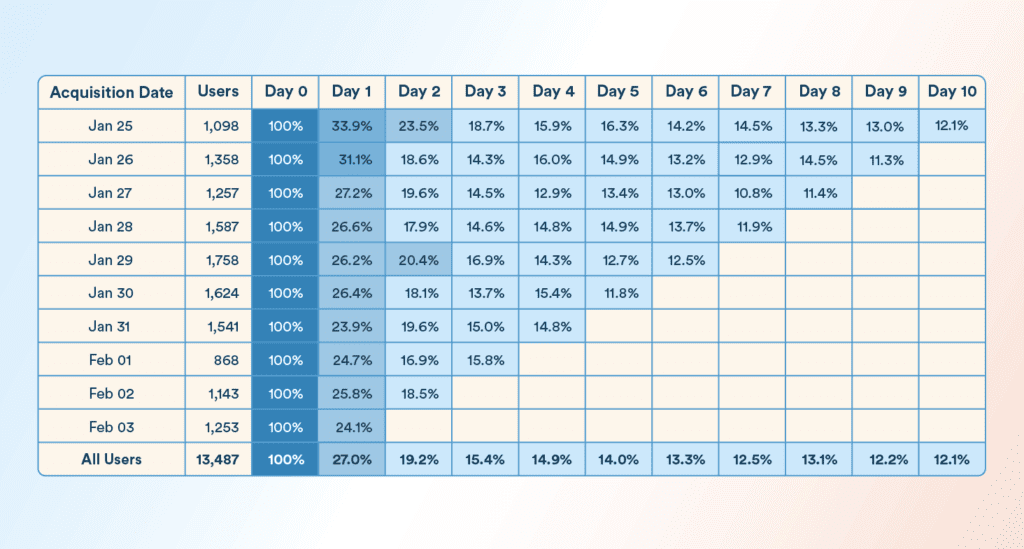
To calculate it:
- Pick a group of users who installed on the same day (a cohort).
- Count how many open the app on the target day.
- Divide that by the total in the cohort.
- Multiply by 100 for the percentage.
For example, if 1,000 users install today and 250 open it tomorrow, your Day 1 retention is 25%.
A good user retention rate varies by app type. Finance apps often hold users longer because people need them daily. Games might lose users faster if they’re not fun enough long-term.
Global App Retention Rate Benchmarks for 2025
In 2025, global averages stay tough. Here’s what recent data shows:
- Day 1: Around 25-30% of users return.
- Day 7: Drops to 10-13%.
- Day 30: Often 4-7%.
iOS apps do better than Android. iOS Day 1 is about 24-27%, Day 30 around 3-8%. Android Day 1 is 20-24%, Day 30 2-6%.
These app retention statistics come from large datasets. For details on industry breakdowns, check this in-depth guide from Sendbird.
Regions differ too. Europe and North America often have steady rates, while faster-growing areas like APAC see quick drops.
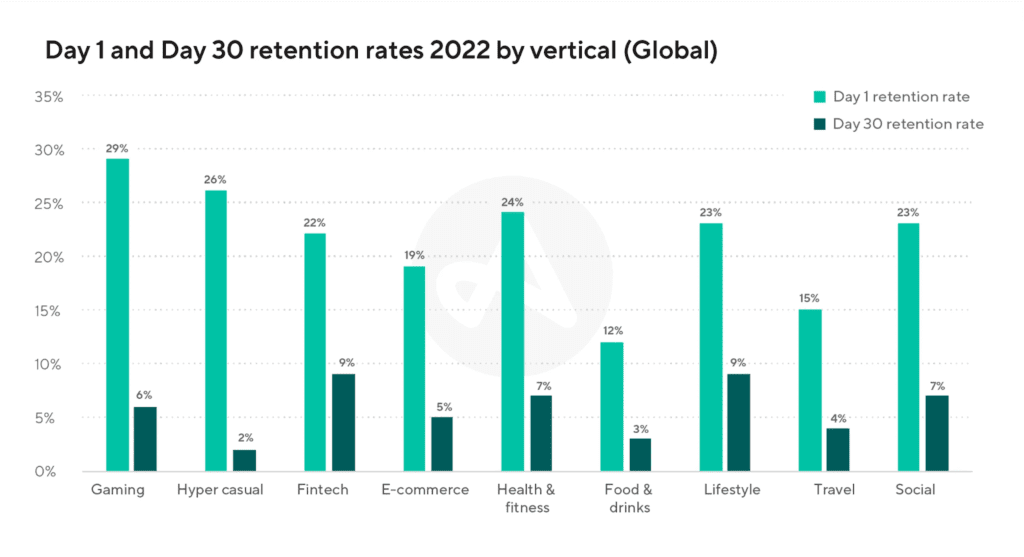
App Retention Rate Benchmarks by Industry
Benchmarks change a lot by category. Apps people use every day, like banking, keep more users. Fun or one-time apps lose them faster.
Here are some best app retention rate benchmarks from 2024-2025 data:
- Finance/Fintech/Banking: Highest rates. Day 1: 22-30%, Day 30: 6-12%. People check money often.
- Shopping/E-commerce/Marketplaces: Day 1: 24-34%, Day 30: 5-9%. Deals and habits help.
- Health & Fitness: Day 1: 20-24%, Day 30: 4-7%. Goals keep some coming back.
- Social Media: Day 1: 23-29%, Day 30: 3-4%. Content feeds drive returns.
- Mobile Game Retention Benchmarks: Lower overall. Day 1: 28-32%, Day 30: 2-5%. Casual games drop fast; puzzles or casinos hold better.
- Travel: Day 1: 16-20%, Day 30: 3-4%. Used only sometimes.
- Productivity: Day 1: 17%, Day 30: 4%.
For more on gaming, see mobile game retention benchmarks in reports like those from GameAnalytics.
Appsflyer retention benchmarks show similar trends, with fintech leading and gaming varying by sub-type. Learn more in this Userpilot article on retention tactics.
What are the best app retention rate benchmarks by industry?
Top performers in 2025:
- Finance/Banking: Day 30 ~10–12%
- Shopping/E-commerce: Day 30 ~7–9%
- Health & Fitness: Day 30 ~5–7%
- Social Media: Day 30 ~3–4%
- Travel: Day 30 ~3–4%
Android vs. iOS Retention Benchmarks
Platform matters for app retention rate benchmarks android and iOS.
- Android: Lower averages. Day 1 ~21%, Day 30 ~2%.
- iOS: Higher. Day 1 ~24%, Day 30 ~4%.
Why? iOS users often spend more and engage deeper. Android has more variety in devices and users.
If your app is on both, track separately. Optimize for each.
Free App Retention Rate Benchmarks and Examples
You can find free app retention rate benchmarks in public reports. Examples1:
- A top fitness app might hit 30% Day 30 with streaks and reminders.
- A casual game could aim for 30% Day 1 with fun hooks.
- Banking apps often reach 10%+ Day 30 naturally.
Look at app retention rate benchmarks examples from leaders. Marketplace apps retain well with variety.
For a full retention handbook, visit this Adjust guide.
How to Improve Your App Retention Rate
Teams use benchmarks to set goals. Here are simple steps to boost yours:
- Fix Onboarding: Make first use easy and fun. Show value fast.
- Personalize: Send tips or offers based on what users do.
- Use Notifications Wisely: Remind gently, not too much.
- Add Engagement Features: Gamify with badges or streaks.
- Gather Feedback: Ask why users leave and fix issues.
- Analyze Drop-Offs: See where users stop and improve those spots.
These help across audiences like product managers tracking KPIs or marketers checking channel quality.
Related: Choosing the right freemium vs paid apps model can impact retention—explore this guide.
FAQs About App Retention Rate Benchmarks
What are typical app retention rate benchmarks in 2025?
Global averages:
- Day 1: 25–30%
- Day 7: 10–13%
- Day 30: 4–7% iOS usually performs slightly better than Android2.
What is a good user retention rate for my app?
“Good” depends on your category. Aim to beat your industry average:
- Finance/Fintech: 6–12% at Day 30 (strong)
- E-commerce: 5–9% at Day 30
- Mobile games: 2–5% at Day 30 If you’re above your category’s average, you’re doing well.
How do mobile game retention benchmarks differ from other apps?
Games often start strong (Day 1: 28–32%) but drop faster. Day 30 rates are usually 2–5%. Puzzle, strategy, and casino games retain better than hyper-casual titles.
Are there differences in app retention rate benchmarks Android vs iOS?
Yes. iOS generally retains better:
- iOS Day 1: ~24–27%, Day 30: ~3–8%
- Android Day 1: ~20–24%, Day 30: ~2–6%
Can you give real app retention rate benchmarks examples?
- A leading banking app often hits 10–12% Day 30.
- Top e-commerce marketplaces reach 8–9% Day 30.
- Successful puzzle games can hold 4–6% at Day 30.
How do I know if my app’s retention is healthy?
Compare your cohort retention curves against the benchmarks above. If you’re consistently below your industry average for two or more cohorts, it’s time to investigate onboarding, engagement, or technical issues.
Why do app retention statistics matter for my team?
Retention directly affects lifetime value (LTV), acquisition cost payback, and investor confidence. High retention means users find ongoing value—key for sustainable growth.
How often should I check my retention benchmarks?
Review monthly. Track trends over time rather than single snapshots. Use cohort analysis to spot improvements or regressions after feature launches or campaigns.
Why Benchmarks Matter for Your Team
Product managers use app retention rate benchmarks to set targets and prioritize features. Growth teams check if ads bring sticky users. Developers spot tech issues causing drops. Founders see if the app has product-market fit.
Track your rates over time. Small wins add up.
In conclusion, understanding app retention rate benchmarks gives your team a clear path to better engagement in 2025. Averages are low, but top apps beat them with smart strategies. Focus on value, personalization, and feedback to stand out. What step will you take first to improve your app’s retention?
References3
- Adjust User Retention Guide – Global and regional benchmarks; great for growth teams evaluating acquisition quality. ↩︎
- Userpilot Blog: App Retention Rate – Provides tactics and benchmarks; helpful for marketers and product managers optimizing UX and campaigns. ↩︎
- Sendbird Blog: App Retention Benchmarks by Industry – Breaks down Day 30 rates by category; ideal for product teams comparing performance. ↩︎